China exported 2.29 million packaging machines in July 2026 (+28% YoY) worth USD 490 million (+4.5%), per customs data. Unit growth far outpaces value growth — a volume-led push concentrated in ASEAN and Russia, while US-bound shipments fell 32.7%. The global packaging machinery market is projected at USD 53–66 billion in 2026 (research-house dependent), growing ~5.5–6% annually.
By The TPM Editorial Team · Data cutoff: China customs through July 2026 · Vol.1 of a quarterly series
If you are sourcing packaging equipment, tracking Chinese exports tells you where capacity is moving — and where your negotiating leverage sits. This quarterly brief compiles customs data and market research into citable tables. Every figure carries its source.
1. The headline numbers (China customs)
| Month (2026) | Export units | YoY | Export value | YoY | Source |
|---|---|---|---|---|---|
| June | 2.39M | +39.6% | $501M | +7.0% | China Customs via Zhiyan |
| July | 2.29M | +28.0% | $490M | +4.5% | China Customs via Zhiyan |
Source: China Customs, compiled by Zhiyan Consulting (chyxx.com)
Reading: unit growth (+28–40%) far outpacing value growth (+4.5–7%) means Chinese exports are winning volume at the entry/mid segment while average unit prices drift down. For buyers, that signals a buyer’s market for standard VFFS/HFFS lines; for suppliers, margin pressure and a push upmarket.
On the import side, July showed 0.29M units (+16.8%) worth $93M (+39.1% ✓ Verified) — imports growing in value faster than volume: China still pays premiums for high-end European and Japanese lines even as it exports volume.
2. Where the machines go (HS 842240)
| # | Destination | June 2026 YTD value | Share | YoY |
|---|---|---|---|---|
| 1 | Thailand | $73.8M | 8.5% | +127.2% |
| 2 | Vietnam | $70.7M | 8.2% | −33.7% |
| 3 | Russia | $66.8M | 7.7% | +47.7% |
| 4 | Indonesia | $65.3M | 7.6% | +1.8% |
| 5 | India | $50.4M | 5.8% | −3.9% |
| 6 | Malaysia | $39.2M | 4.5% | −4.8% |
| 7 | USA | $38.4M | 4.4% | −32.7% |
| 8 | Brazil | $27.6M | 3.2% | +39.0% |
| 9 | Singapore | $25.6M | 3.0% | +71.8% |
| 10 | South Korea | $24.1M | 2.8% | +14.1% |
Source: China customs via TOPEASE, HS 842240 (packing/wrapping machinery incl. heat-shrink), June 2026 cumulative
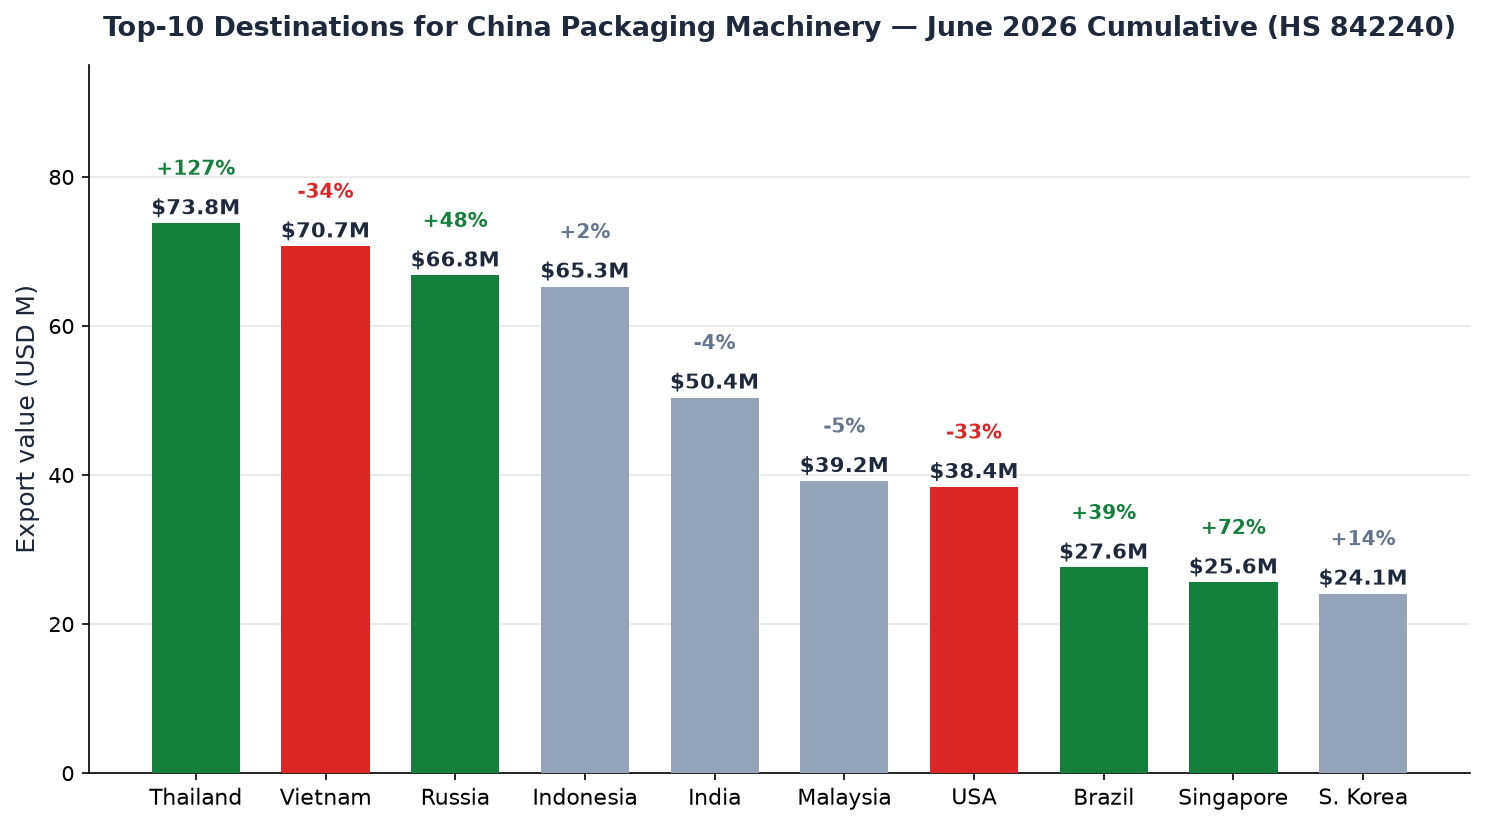
Three stories in the data:
- ASEAN is the anchor. Four of the top six destinations are ASEAN members. Fujian province alone exported ¥10.8B (+13.5%) in the first seven months, 86% from private companies (Fuzhou Customs via Southeast Net).
- Russia re-routing is real. +47.7% growth as Western brands exit the market.
- The US is the visible decline. −32.7% — tariffs reshuffling flows, with buyers shifting to Thailand/Vietnam contract manufacturing bases.
3. The global backdrop
| Research house | 2026 estimate | CAGR | Note |
|---|---|---|---|
| China Baogao (chinabgao) | USD 53B+ | 5.58% | Asia-Pacific >42%; China = 29.3% of global consumption |
| 360iResearch | USD 54.5B | 5.82% | Forecast USD 76.6B by 2032 |
| Coherent Market Insights | USD 65.8B | 6.3% | Broader scope incl. processing equipment |
Note: estimates diverge because scope definitions differ; we list all three rather than cherry-pick.
Consensus points: ~5.5–6% annual growth, filling machines ≈30% of the market, food & beverage ≈38% of demand. A PMMI survey found 88% of snack producers plan new packaging equipment investment by 2027.
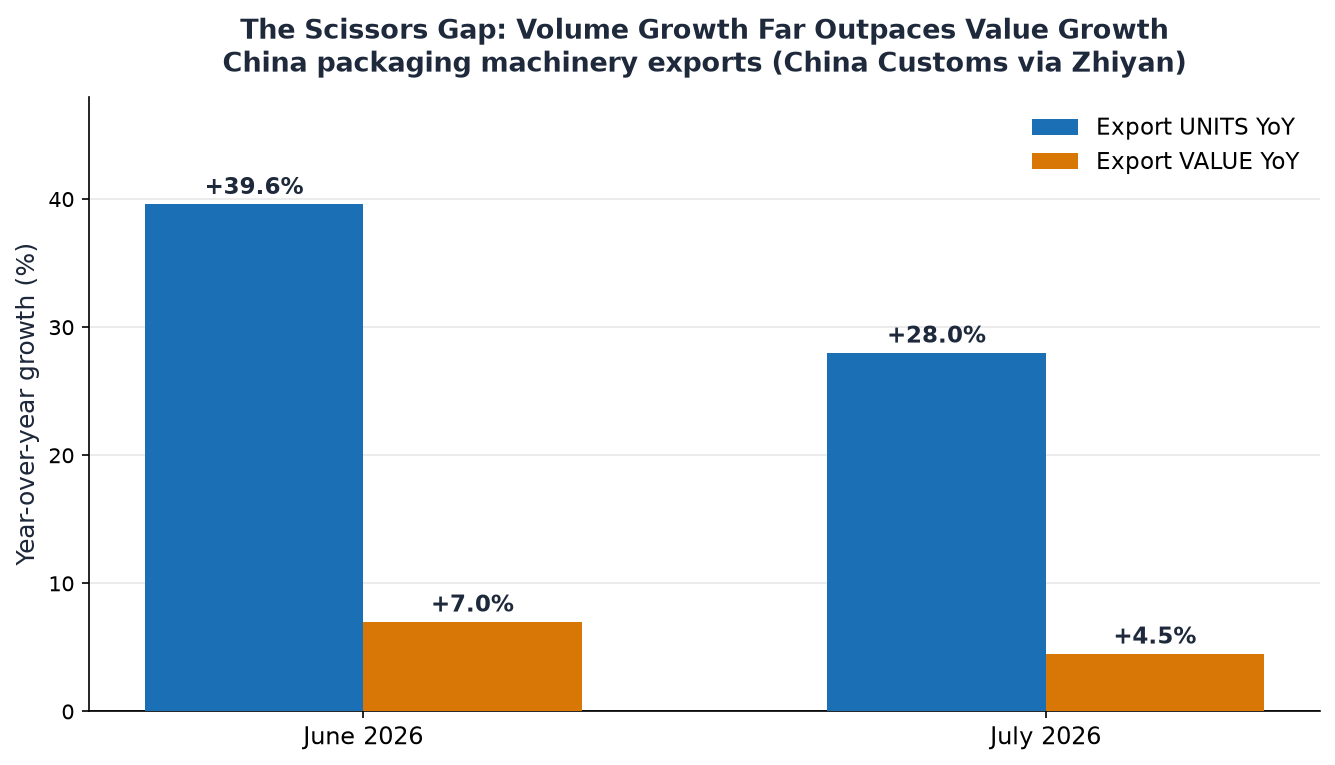
If you are buying standard VFFS or flow-wrap lines in 2026, you are in a buyer’s market — Chinese unit exports are growing 5x faster than the global market, and suppliers are competing on volume. If you need high-speed or compliance-critical lines, premiums persist: China’s own imports are growing faster in value than in volume.
4. What it means for buyers (editorial take)
- Squeeze in the middle. Chinese volume exports (+28%) vs premium imports (+39% value) — mid-market buyers get price leverage; high-speed/high-compliance buyers still pay up.
- ASEAN capacity buildout. If you package in Thailand, Indonesia, or Vietnam, local service coverage from Chinese suppliers is improving fastest — factor this into supplier shortlists, not just machine price.
- US tariff window. US-bound flows are down a third; buyers in the Americas may find Chinese suppliers more negotiable in 2026 than in 2024.
5. Methodology and sources
- China customs monthly data via Zhiyan Consulting (chyxx.com); TOPEASE HS-842240 report; Fuzhou Customs via Southeast Net (Aug 2026)
- Global market size: China Baogao, 360iResearch, Coherent Market Insights — divergent scopes noted where relevant
- TPM editorial analysis is clearly separated from sourced data
- Data cutoff: customs data through July 2026 (published September 2026)
TPM publishes this export-data brief quarterly. For questions, data requests, or on-record quotes, contact the editorial team via our contact page. We respond within one business day.